Tracing templates for greater understanding

A picture tells a thousand words, so we added an exciting new development tool to explore which templates are used during page rendering. Our new tool gives a graph view of all templates.
Just from the template code this can be hard, especially when confronted with existing projects or modules. Our new development tool gives new insight in all templates used, and even better, it can be used on live production systems!
It works by tracing all templates includes, extends or overrules. This builds a graph of how the templates are used.
Example
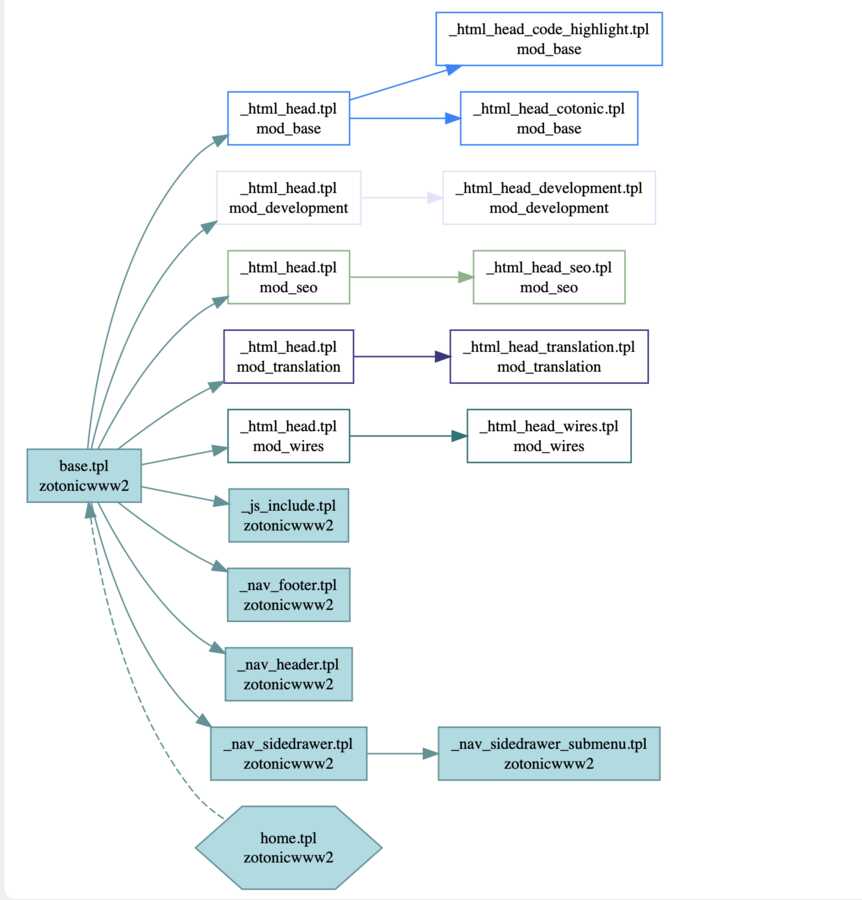
For example, this is the home page of this site.

All nodes are templates, all arrows are includes. A node contains the template name and the module of the template. Templates from the current site have blue background. All other templates have a border and arrow color depending on the module.
A start template is marked with a hexagon, in this case home.tpl. The striped line from home.tpl to base.tpl shows that home.tpl extends base.tpl. A dotted line would show an overrules.
A graph can be generated for the current session, recording all includes made by you on your browser. Or all sessions can be traced, giving an overview of the live system.
Where to find this?
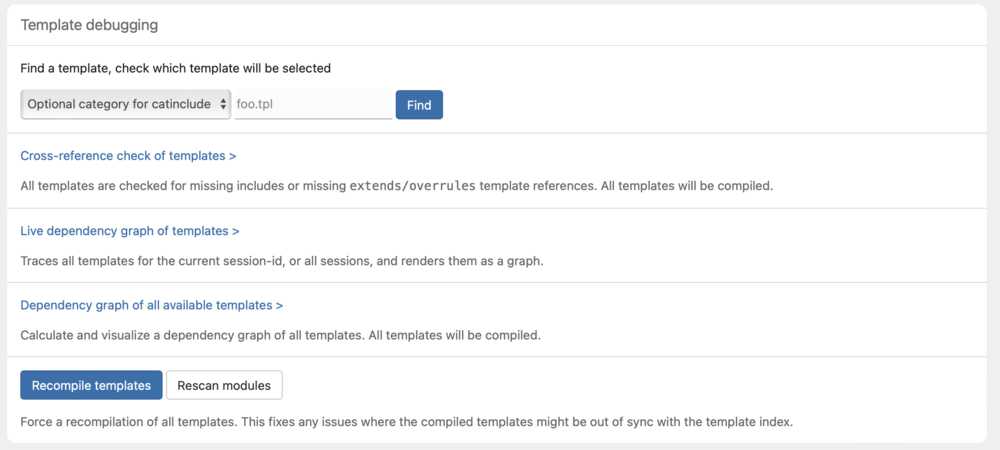
You can find this in the admin, under System > Development, in the Template debugging widget click on Live dependency graph of templates.

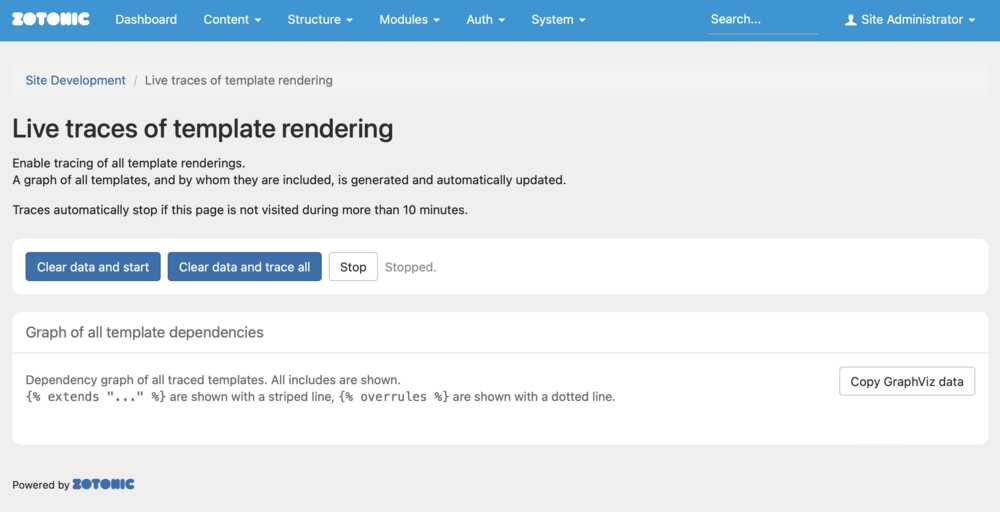
This will bring you to the following page:

Start the tracing by clicking on either of the two blue buttons. Mostly the button Clear data and start is the one you want, as that will trace only your own session.
The screen will update automatically whilst data is collected. Click on Stop if the view is complete.