Choose a development tool
Start with the symptom and use the smallest tool that explains it.
| Symptom | Tool |
|---|---|
| Wrong markup | Template selection and live template trace |
| Unexpected URL handling | Dispatch list and path trace |
| Slow page | Database trace, logs, then focused function trace |
| Observer does not run | Observer list and module status |
| Saved changes are missing | Build output, file handling, template selection |
| Result changes after a flush | Cache keys and invalidation |
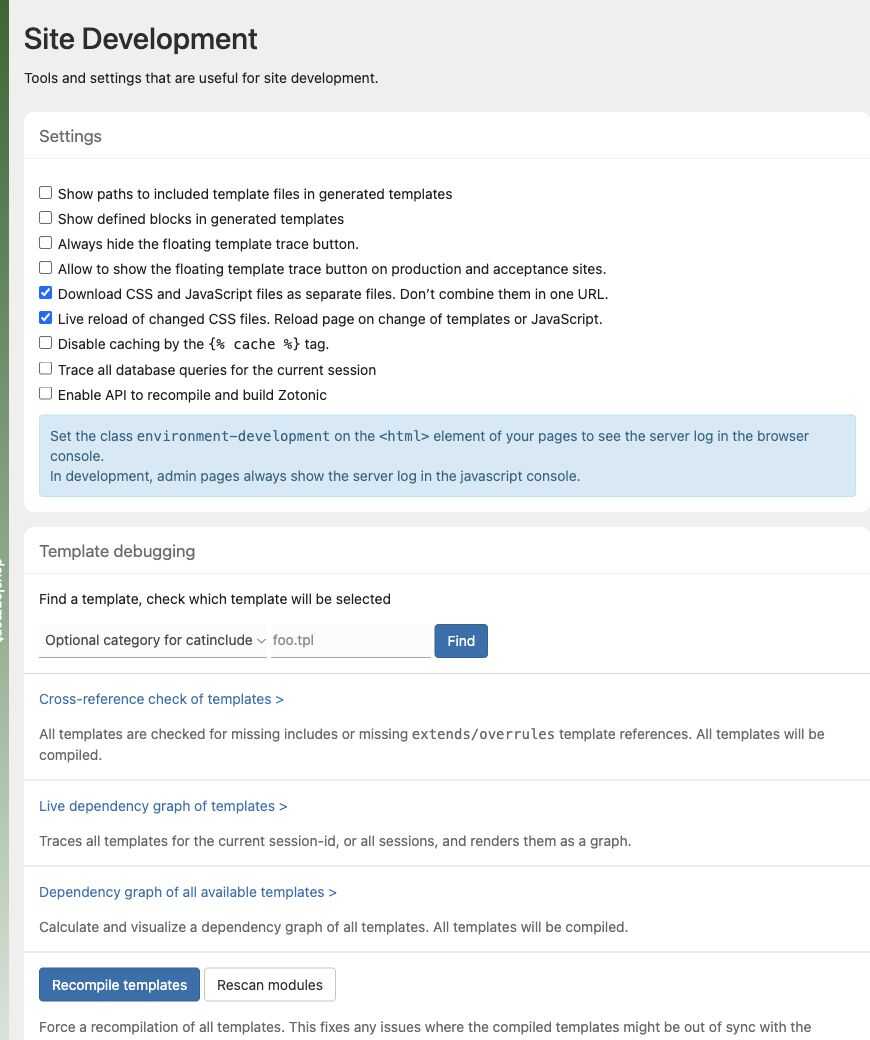
Open System → Development to find these controls. The checkboxes shown are the test site’s settings; enable only the tools needed for your current investigation.
Enable the Development module on your local site. Keep the ordinary browser developer tools open for network and JavaScript problems. See Enable the Development module, Trace templates rendered by a request, and Trace a URL through dispatch.